Sample 3 Statistics: Assignments and Solutions
Contents
Statistics
Example one: Hypothesis Testing
Purpose of Assignment
The purpose of this assignment is to develop students’ abilities to combine the knowledge of descriptive statistics covered in Weeks 1 and 2 and one-sample hypothesis testing to make managerial decisions. In this assignment, students will learn how statistical analysis is used in predicting an election winner in the first case. In the second case, students will conduct a hypothesis test to decide whether or not a shipping plan will be profitable.
Statistics: Assignment Steps
Resources: Microsoft Excel®, Case Study Scenarios, SpeedX Payment Times
Develop a 700- to 1,050-word statistical analysis based on the Case Study Scenarios and SpeedX Payment Times.
Include answers to the following:
Case 1: Election Results
Use 0.10 as the significance level (α).
Conduct a one-sample hypothesis test to determine if the networks should announce at 8:01 P.M. the Republican candidate George W. Bush will win the state.
Case 2: SpeedX
Use 0.10 and the significance level (α).
Conduct a one-sample hypothesis test and determine if you can convince the CFO to conclude the plan will be profitable. Format your assignment consistent with APA format.
Submit your assignment.

SOLUTION
Statistical analysisÂ
Student’s Name
Institution Affiliation
CourseÂ
DateÂ
One-Sample Hypothesis Testing Cases
This paper develops different skills required in combining descriptive statistics knowledge and one sample hypothesis testing, in making different decisions in management. First, the paper covers a statistical analysis of a case study used to find out an election winner. In the second case, a hypothesis test will be run to see whether or not a shipping strategy will be helpful to SpeedX organization.
Case 1Â
At any time of the presidential election many TV systems abandon their usual coverage to widely cover the race. After every one of the votes is counted, the outcomes are passed on to people in general. Considering the nature of the presidential office in US, the broadcasting channels energetically endeavor to figure out who will be the first to predict the new president. Through the use of exit polls, a questioning of a random sample of voters is done on the candidate they voted for. This processes is conducted aimed at gathering enough data to aid in predicting the winner.
On the collected data, an examined level of percentage of voters backing every one of the candidates id determined. Hypothesis testing is then conducted to see whether or not there is sufficient proof to anticipate the top runner who will win enough votes to turn him to be the new president (University of Phoenix, 2017).Â
In this study, voters from the exit polls in Florida State were surveyed during the 2000 election year. The researchers only recorded the votes of the two leading candidates who had any possibility of winning including Democrat Al Gore and Republican George W. Bush. The sample of 765 voters recorded revealed the number of casted votes for Al Gore was 358 and the number of casted votes for George W. Bush was 407.Â
The predictions from the network state the candidate will win if he has more than 50% of the votes. The elections closed at 8:00 pm and based on the sample results; the researchers conducted a one-sample hypothesis test to determine if at 8:01 pm the networks should broadcast that the Republican contender, George W. Bush, will win the state. The one-sample test used a 0.10 significance level (α) (University of Phoenix, 2017).
Election Results
In this case, it is desired that the networks test the data, so it shows there is enough statistical evidence at 0.10 significance levels to conclude that the percentage of supporters who voted for George W. Bush were more than 50%. Therefore, the hypotheses tested were:Â
H0: p ≤ 0.50 and H1: p > 0.50
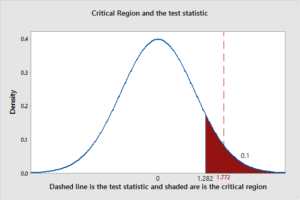
Due to this being an aright-tailed one-sample test for the proportion a Z test was conducted using 0.10 as the significance level:
Z test statistic> Critical value = Z0.10 = 1.28
The given data calculates as:
Z test statistic = xn–p0p0*1–p0n=407765–0.50.5*1–0.5765 = 1.7716
The test shows the result is in the rejection area; therefore, the null hypothesis is rejected at the 0.10 significance level. The result bases from the given data are that at 8:01 pm the networks must announce Republican candidate George W. Bush wins Florida. The following chart is a visual aid to show the results of the Z test:
SpeedX
SpeedX is a big courier company which ships invoices to clients, the company request their payments be received within 30 days. The invoices list an address and patrons must use their packages to return the costs. The given data states the mean and standard deviation regarding the amount of time it takes to pay the bills are 24 days and six days. An idea presented by the CFO is if the company includes a self-addressed stamped envelope the amount of time it takes to receive payment would decrease. She estimates the enhanced cash flow from a 2-day reduction in the payment period would cover the cost of the self-address stamped envelopes.Â
To test the CFO’s idea, I randomly select 220 customers to proceed with the proposal to include a self-addressed stamped envelope with the statements. The CFO agrees to run the study to begin a statistical analysis to determine if the idea will be a success. I recorded the numbers of days it took to receive the payments and conducted a one-sample hypothesis test to determine if the plan will be profitable (University of Phoenix, 2017). While conducting the test, I used a 0.10 significance level (α). It was concluded that the plan would be gainful if the average numbers of days until compensation is received decreases more than two days:Â
H0: µ ≥ 22 and H1: µ < 22
The statistical test is left tailed for a single population mean, and the population standard deviation is known; therefore, a Z-test for mean is conducted.Â
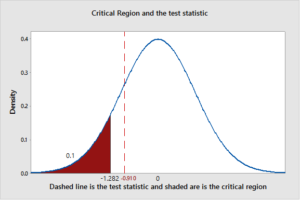
Due to there being a 0.10 significance level the rejection area is:
Z test statistic< Critical value = -Z0.10 = -1.28
Calculating from the data that was given, I concluded:
Z test statistic = Sample mean–µ0n=21.63181818–226220 = -0.9102
The statistical test is not falling in the rejection area; therefore, the null hypothesis should not be rejected at a 0.10 significance level. My conclusion, based on the results, is the result is not showing enough evidence that the proposal will be profitable. The following graph is a visual aid to help the CFO understand why the plan will not work:
Conclusion
By using statistical testing, educated results will be found, and predictions can be made. The proceeding paper shows the results of these tests and gives the answers the networks and SpeedX were looking for to proceed with their desires. In one case, the networks could successfully predict the winner of the election for the state of Florida. In another case, the SpeedX Company could conclude that a new business venture to receive payments more promptly would not be profitable.
Reference
University of Phoenix. (2017). Case Study Scenarios [Multimedia]. Retrieved from University ofÂ
Phoenix, QNT/561 – Applied Business Research& Statistics website.
Example 2
1. Various temperature measurements are recorded at different times for a particular city. The mean of 20ºC is obtained for 40 temperatures on 40 different days. Assuming that σ=1.5ºC, test the claim that the population mean is 22ºC. Use a 0.05 significance level.
Identify the null hypothesis, alternative hypothesis, test statistics, P-value and final the conclusion about the original claim.
solution
We first state the hypothesis:
Ho: µ=22 vs Ha: µ≠22
Then we go on to calculate the test statistics
Z=(ӿ-µ)/ð/√n=(20-22)/1.5/√40 = -8.433
p-value = Z 8.433 Where from Z tables Z8.433<0.0001
And since the p-value is less than significance level given (0.05) we have enough statistical evidence to reject null hypothesis and conclude (µ≠22) mean not equal to 22 and clearly since our test statistic is a negative value we can clearly conclude that mean is actually less than 22 in this given case.